New Features
Mapping 3D Structures to Pathways
08/23
A metabolic pathway is a sequence of chemical reactions that occurs within a cell. Enzymes act on substrates, also called metabolites, to perform a series of chemical reactions. The product of one chemical reaction becomes the substrate for the next reaction in the pathway. These metabolic pathways are linked to important processes that allow cells to utilize energy, perform biosynthesis, and many other important and fundamental mechanisms required for cells to function.
3D structures of an increasing number of proteins that perform reactions within metabolic pathways are available in the PDB. To accommodate a deeper structural view of biology, the new Pathway View allows users to browse through well-characterized metabolic pathways and access the corresponding PDB entries. These data have been derived as part of Genome Scale Models in systems biology (King, et al.).
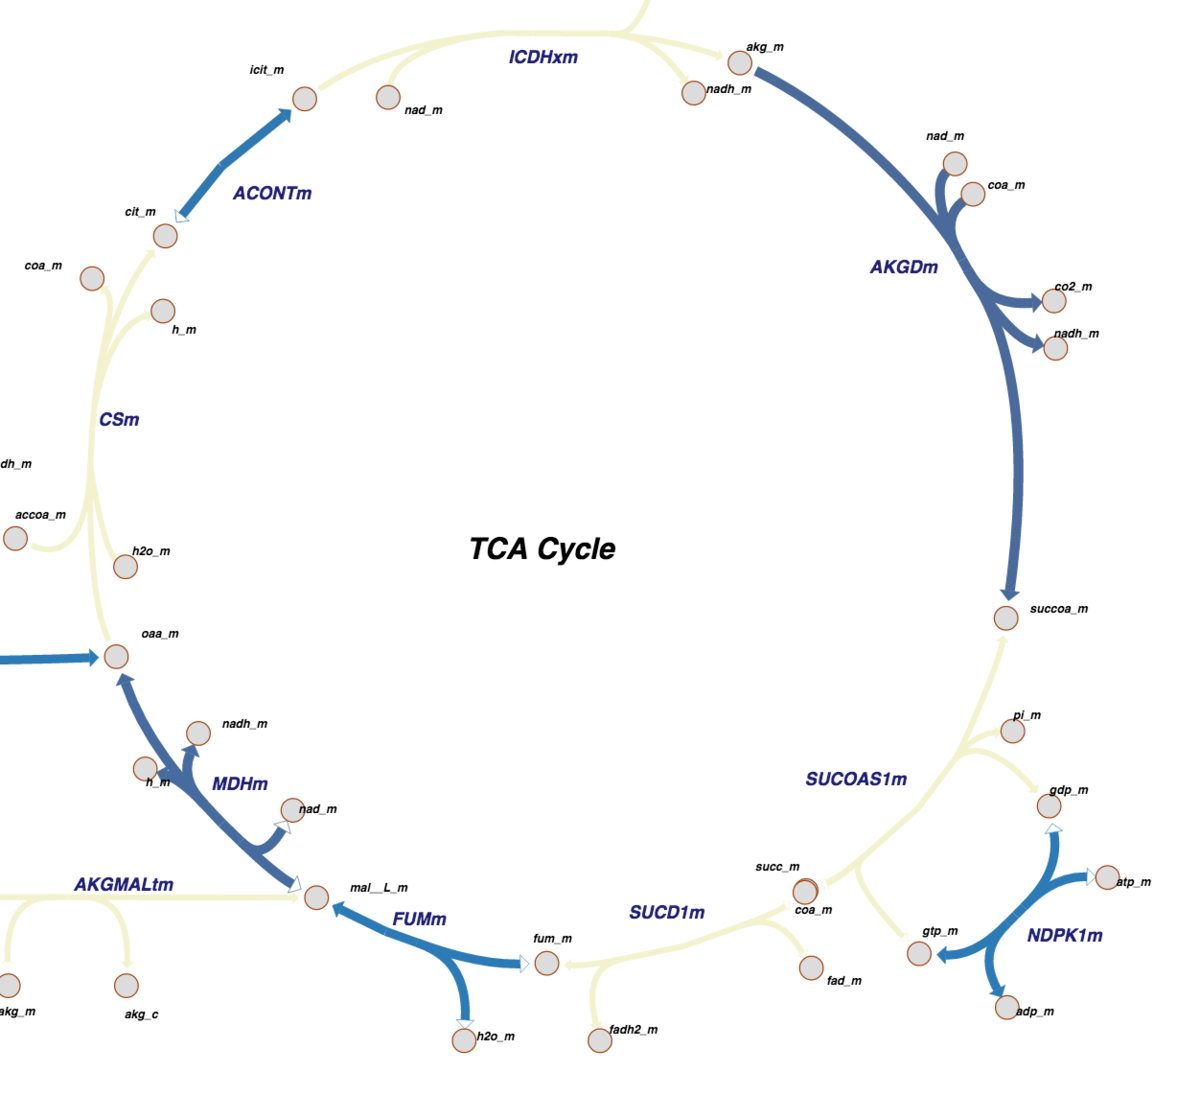
 The new Pathway View provides a graphical representations of metabolic pathways. The color-coding indicates what parts of the pathway have been determined at atomic level resolution in PDB, inferred via homology models, or cannot be modeled right now.
 Pathway View Access
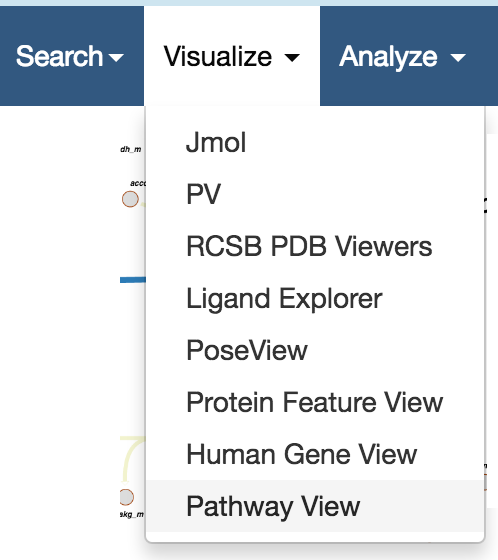
Access Pathway View from Visualize options tab on the home page or top menu. It has also been integrated into the Structure Summary pages of PDB entries linked to pathways. In addition, the Protein Feature View page displays a map of the relevant pathway portion if the corresponding UniProt sequence is linked to a metabolic pathway.
Search for pathways
Pathway reaction names can be used as search terms, with suggestions for PDB entries linked to a reaction returned.
Protein Feature View
Small maps depicting pathways adjacent to reactions of interest are available in the Protein Feature View.
Origin of Data
Mapping of reactions to 3D structures is based on data provided by the GEM-PRO project. Reconstructions of pathways are based on the BiGG database, a knowledgebase of biochemically, genetically, and genomically-structured genome-scale metabolic network reconstructions. A genome-scale network reconstruction represents a curated knowledgebase comprising many different data types and sources, including high-quality genome annotation, assessment of biochemical properties of gene products, and a wide array of physiological functional information (Brunk, et al.). Over the past three years, a deluge of ‘omics’ data has enhanced the ability to characterize the metabolites, reactions, proteins and genes in an organism-specific manner, to which there are now more than 75 high-quality, manually-curated genome-scale metabolic models for organisms ranging from bacteria to humans (King et al.). The UniProt to PDB mapping is available from the SIFTS initiative.
Pathway Visualization Software
The visualization of the pathway data uses the Escher pathway visualization software (website). BiGG pathway maps are rendered as SVG graphics using the d3 javascript library.
Pathway visualization is color coded to indicate which parts of a pathway correspond to PDB structures.
- In a reaction pathway map, each arrow represents a reaction and each node represents a metabolite.
- The size and color of each reaction arrow indicates the number of PDB entries or homology models that are associated with it.
If there is no PDB entry associated with a reaction, its arrow will be gray.
If there are only homology models associated with a reaction, its arrow will be yellow.
If there are PDB entries associated with a reaction, the color of its arrow will vary from light blue to dark blue depending on the number of associated entries in that map. - The color of a metabolite node indicates the presence (blue) or absence (gray) of the compound in the wwPDB Chemical Component Dictionary.
- Selecting a node or arrow will reveal the associated ligand ID or a list of the associated PDB entries, respectively.
- The last character of a metabolite may indicate its compartment : _c -> cytosolic _m -> mitochondrial _e -> extracellular space
- The lighter numbers displays the stoichiometry of the metabolite in the reaction. When it is 1, the number is hidden.
Reference Links
- Systems biology of the structural proteome. Brunk E, Mih N, Monk J, Zhang Z, O'Brien EJ, Bliven SE, Chen K, Chang RL, Bourne PE, Palsson BO. 10.1186/s12918-016-0271-6
- Escher: A Web Application for Building, Sharing, and Embedding Data-Rich Visualizations of Biological Pathways. King ZA, Dr?ger A, Ebrahim A, Sonnenschein N, Lewis NE, Palsson BO. PLoS Comput Biol. 2015 Aug 27;11(8):e1004321. 10.1371/journal.pcbi.1004321
- BiGG Models: A platform for integrating, standardizing and sharing genome-scale models. King ZA, Lu J, Dr?ger A, Miller P, Federowicz S, Lerman JA, et al. Nucleic Acids Res. 2016;44: D515ĘC22. 10.1093/nar/gkv1049


